Today: status and next action
A calm snapshot of current evidence, notes, and the clearest signals, with quick access to Record, Settings, and Reports.
Today • Diary • Insights
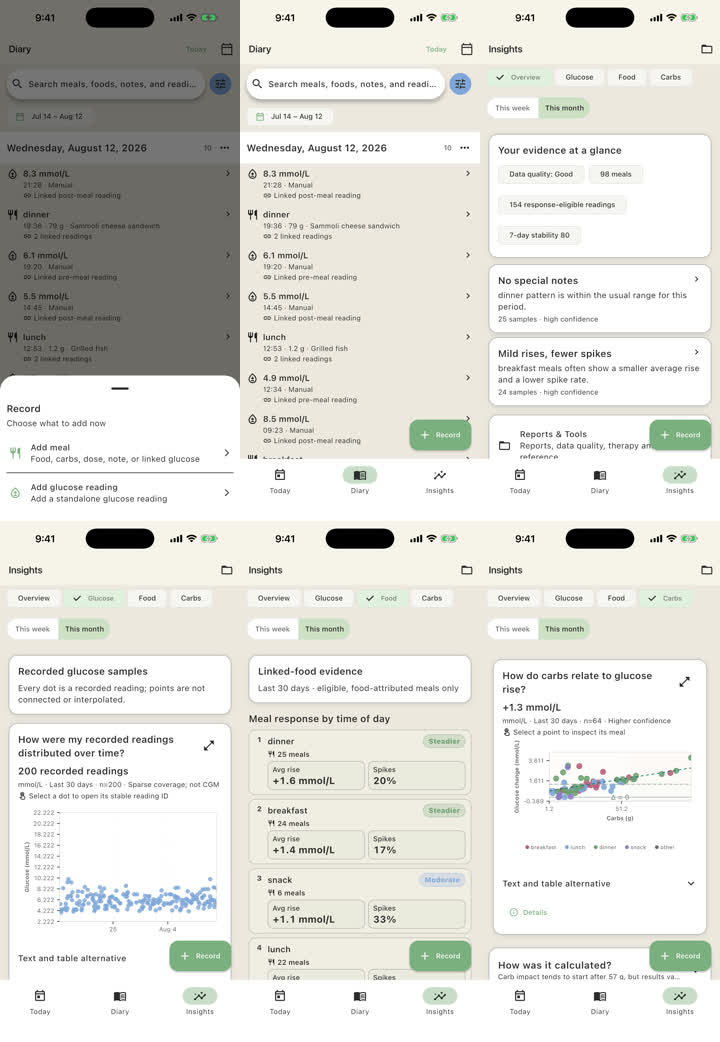
SugroLy brings meals and glucose readings into a clear Diary, then presents Insights through four connected views: Overview, Glucose, Food, and Carbs—with period, sample, and evidence limits.
Record. A meal or reading from one clear gateway.
Review. Everything in a searchable, filterable Diary.
Understand. What repeated, with period, sample, and data sufficiency.
A new structure and a shorter path
SugroLy is redesigned around what people need: today's status, a trustworthy history, then insights grounded in eligible data.
A calm snapshot of current evidence, notes, and the clearest signals, with quick access to Record, Settings, and Reports.
Meals, glucose readings, and linked records in one timeline with search, filters, date navigation, details, and editing.
Overview, Glucose, Food, and Carbs, with a path from each summary to supporting evidence.
Periodic reports, data quality, and profile-relevant tools; general backup and export remain in Settings.
Analytics center
Each tab answers a different question, then SugroLy brings the signals together into connected insights you can review with clarity.
What happened after meals?
Review post-meal glucose change, how often the app rise line is crossed, differences between meal types, and patterns across the last 7 or 30 days.
Which foods were linked to recurring patterns?
SugroLy connects foods to logged meals and compares higher- and lower-response frequency and pattern stability without labeling food as good or bad.
How did response vary across different amounts?
Explore the descriptive relationship between carbohydrate amount and glucose change, comparing lower, medium, and higher ranges when enough eligible meals are available.
What is the clearest takeaway?
The insights layer brings together the clearest patterns, repeated meals, period changes, and evidence sufficiency in concise cards with supporting detail.
From a number to meaning
It shows where the response repeated, how it differed by meal type or carbohydrate amount, and how many records support the observation—helping you separate a clear pattern from an early coincidence.
An illustrative example of how results are shown; it does not show real health data.
Capabilities that grow with your use
SugroLy is not an analytics screen detached from your day. It is a connected journey that starts with an organized log and ends with a review you can understand and share.
Current status, next action, notes, and the strongest signals in one concise view.
Meals, readings, and linked records with filters, date navigation, details, and editing.
Overview, Glucose, Food, and Carbs, with a path from each summary to its evidence.
Review the last 7 or 30 days and compare what changed or persisted across periods and meal types.
Find food, build meals and recipes, and retain the amount context required for better analysis.
Summarize a period of logs and insights for personal review or a more organized discussion with your care team.
Keep a copy of your data under your control, with optional protection and encryption for backups.
Read supported Apple Health or Health Connect data after permission, and turn the connection off whenever you choose.
An important additional advantage
Core logs and analytics are local-first. We do not sell your health logs, and health-platform connections or exports begin only when you choose them.

Now on the App Store and Google Play
Download SugroLy now from the App Store or Google Play—choose the store for your device.